
Ed Dickerson, director of product at Fast Track, on what 1.7 million sessions tell us about how long GGR takes to reveal player value, and how True Value can measure it from the first
Picture a Monday morning. A VIP manager is looking at a player who joined ten days ago. Six sessions, healthy stakes, and on Saturday night he landed a big win. The account is deep in the red. Is he a problem, a future high roller, or just lucky? The honest answer is that nobody in the building knows, and they will not know for months.
Down the corridor, an affiliate manager has the opposite problem. A new partner has sent a few hundred players in a fortnight and the revenue looks wonderful. She is about to raise their commission. Same question. Same honest answer.
I have spent a long time in this industry, and for most of it we have answered questions like these with one number: gross gaming revenue. GGR is what the money did. It is a fact, and a useful one. But it is not what the play was worth, and the gap between those two things is where the industry has been guessing.
This piece is about that gap. It uses 1.7 million real sessions, drawn from several brands on the Fast Track platform over 144 consecutive days, to show how far apart the two numbers can be, how long they take to meet, and what changes for an operator once it can see both.
Two numbers
GGR is stakes minus winnings: the cash that ended up on the operator’s side of the table. There is nothing wrong with it as a fact.
The trouble starts with what we ask it to do. Is this affiliate sending good traffic? Is this welcome offer costing more than it did in the spring? Is this player, three sessions in, someone we should look after? Every one of those is a question about what play is worth, and GGR answers a different question: what did the money do?
The difference between the two is luck. A player who lands a big win produces a GGR far below the value of their play. A player who lands nothing produces one far above it. The play was worth the same in both cases. Give it enough sessions and the luck cancels out, and GGR becomes a fair guide to value. So the real question is: how many sessions is enough?
Where a single session lands
Take one real session and divide its GGR by what that same play was worth. If GGR measured value, the answer would sit near one. It does not.
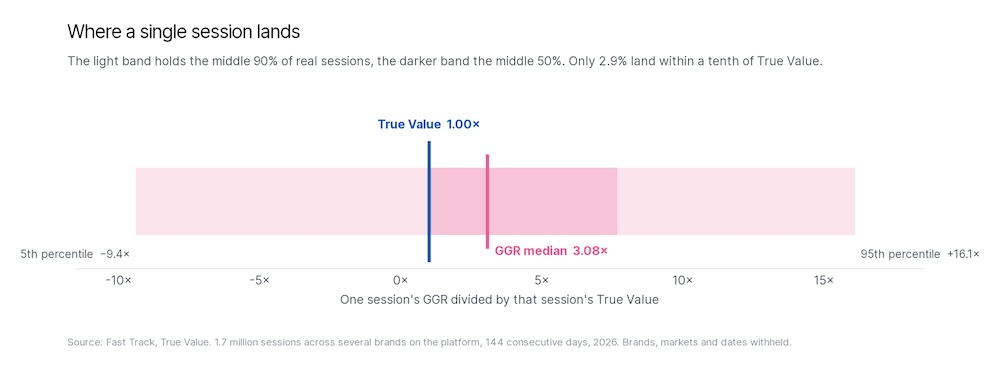
Chart 1. Where a single session lands. The light band holds the middle 90% of real sessions, the darker band the middle 50%. Only 2.9% land within a tenth of True Value.
Across the middle 90 per cent of sessions, that ratio runs from minus 9.4 to plus 16.1. The median session returned three times its value. Only 2.9 per cent of sessions landed within a tenth of the right answer. On a single session, GGR and value are almost unrelated: the correlation across the whole book is 0.26.
None of that is surprising to anyone who has watched a casino floor. It is what variance looks like at the level of one player and one sitting. What matters is what happens as you add sessions together, because that is what every operator does when they judge a player, an offer or an affiliate.
How long GGR takes to settle
We drew random samples of sessions from the book at every size from one to a quarter of a million, four thousand samples at each size, and compared the GGR of each sample with the True Value of the same play.
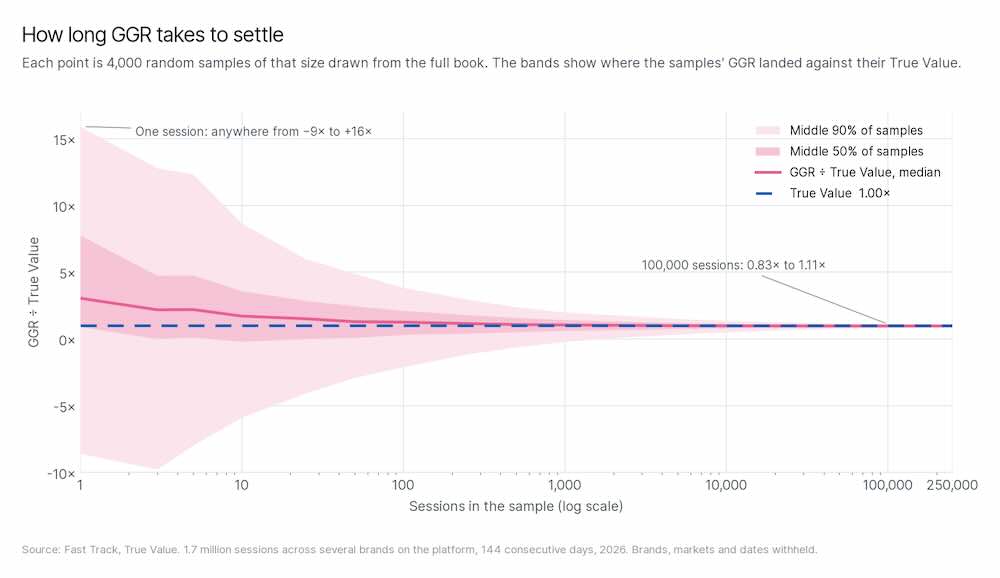
Chart 2. How long GGR takes to settle. Each point is 4,000 random samples of that size. The bands show where the samples’ GGR landed against their True Value.
At one session, the middle 90 per cent of outcomes runs from minus 9.4 times value to plus 16.1 times. At a hundred sessions the median is still 1.23, meaning the typical hundred-session sample returned 23 per cent more than its play was worth. At a thousand sessions the middle 90 per cent still spans minus 0.2 to plus 2.0. It takes a hundred thousand sessions before that band narrows to 0.83 to 1.11.
The point is not that GGR is wrong. It is that GGR is a sample, and most commercial decisions are made on samples far smaller than the ones it needs.
The dangerous dozen
There is a stretch of that curve that every operator should know about, because it is the stretch where new things get judged.
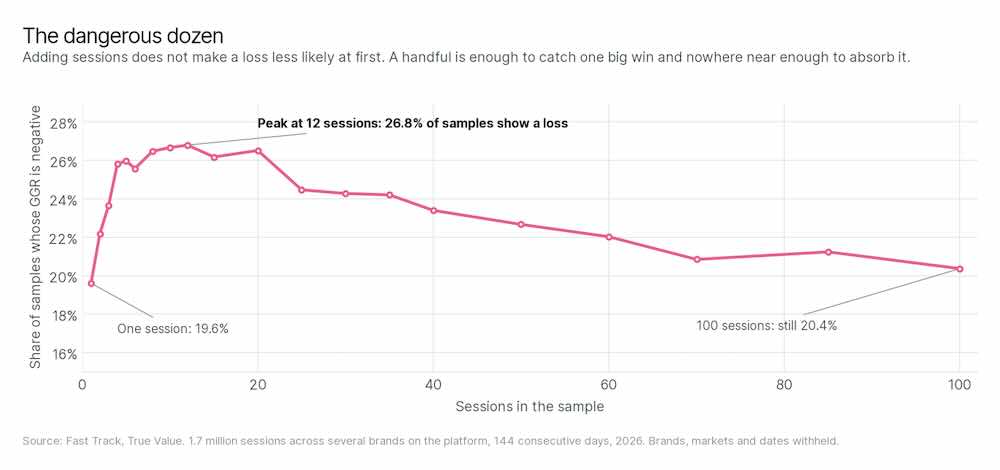
Chart 3. The dangerous dozen. The share of samples showing a loss rises from 19.6% at one session to 26.8% at twelve, and is still above 20% at a hundred.
You might expect that adding sessions steadily reduces the chance of a sample showing a loss. It does not, at first. At one session, 19.6 per cent of samples show a loss. At twelve sessions that share has risen to 26.8 per cent. It is still above 20 per cent at a hundred. A single session is usually a small win for the house. A dozen is enough to catch one large payout and nowhere near enough to absorb it.
A dozen sessions is also roughly how long a new player has been with you when their welcome journey ends. It is how much traffic a new affiliate has sent when you first look at their numbers. It is how many times a new bonus has been played when someone asks whether it is working. The window in which the industry judges new things is the worst-behaved window on the whole curve.
The price of measuring with money
How big does a sample need to be before GGR is a reliable measure of value? Here is one way to answer it: the share of samples whose GGR lands within ten per cent of the value of the play.
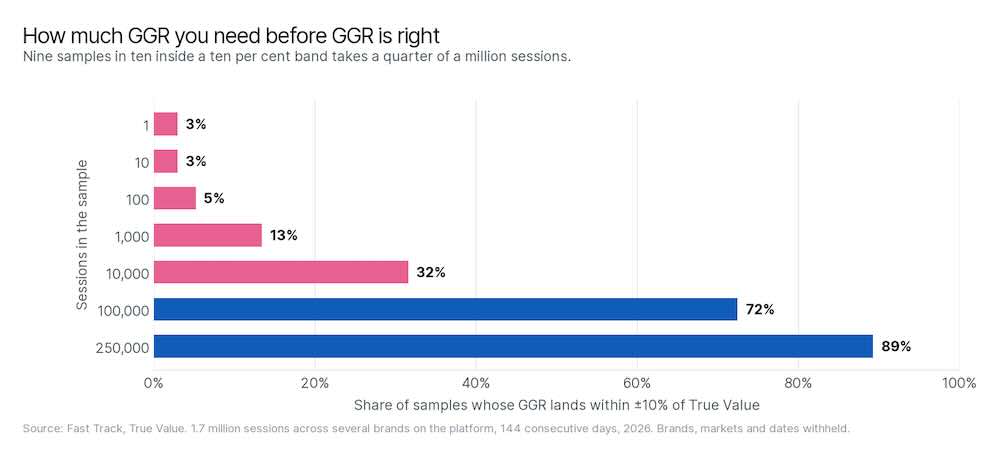
Chart 4. How much GGR you need before GGR is right. Share of samples whose GGR lands within 10% of True Value.
At a thousand sessions, one sample in eight passes. At ten thousand, just under one in three. To get nine samples in ten inside a ten per cent band takes a quarter of a million sessions. Very few offers, affiliates or players ever accumulate that many. That is the price of measuring value with money.
Other metrics do not solve it
There are other numbers, of course. A deposit to bonus ratio, turnover multiplied by house edge, average bonus cost, cash to bonus turnover ratios, play frequency. Operators already use all of them to try to work out what a player is worth.
They help, but they do not answer the question. Two players can deposit the same amount and be worth very different amounts. Two players can play the same bonus and have very different values depending on how they play it.
The problem is not that the industry lacks data. It is that most of the numbers we use are proxies for value. They describe the things around it. They do not measure the play itself.
The other number
True Value is the theoretical GGR of a session: what the operator would earn if that exact pattern of play were repeated millions of times. It is calculated from the games played and their return to player and volatility, the stakes, the sequence, the bonus in play and its terms such as wagering requirements. Every one of those things is known the moment the session ends. Nothing has to be learned from outcomes, so nothing has to wait.
That has a consequence that took me a while to get used to. The first session in the book is measured as accurately as the 1.7 millionth. A player who has played once has a True Value. An offer taken up forty times has a True Value. An affiliate three weeks old has a True Value. All of them arrive with the play, not months after it.
Two things are true here and it is worth keeping them apart. The measurement of play that has happened is exact, on session one. What sharpens as sessions accumulate is how much of a player’s future that measurement tells you. You never write a player off on two sessions. Some of them turn good. But you no longer have to wait a year to know what the sessions they have played were worth.
The magnet
If True Value is the right number, GGR should move towards it over time. Here is the same estate, day by day, for 144 consecutive days. To keep the operators anonymous, both measures are shown as an index, with the period’s average True Value per session set to 100.
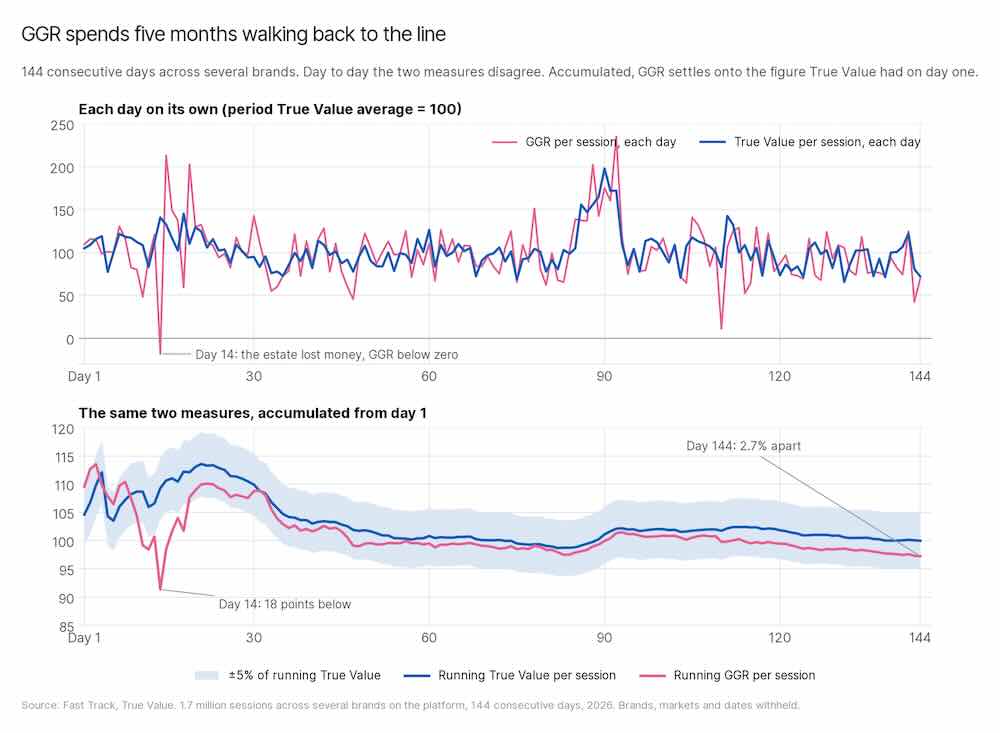
Chart 5. GGR spends five months walking back to the line. 144 consecutive days across several brands, indexed to the period average True Value per session (100): each day on its own, then the running averages with a 5% band around True Value.
Day to day, True Value per session moved between roughly two-thirds of its average and twice it. GGR per session moved between below zero and two and a half times the average, wider at both ends and the only measure that ever went negative. On day 14 the estate lost money outright.
The running average tells a different story. It started about five per cent above True Value, fell to 16 per cent below it on day 14, and from day 19 never left a five per cent band around the True Value line again. By day 144 the two totals were 2.7 per cent apart. GGR spent five months walking back to a figure True Value had on day one and never revised.
That is why I describe True Value as a magnet. GGR always moves towards it. Pricing on True Value is not a different opinion about what a player is worth. It is the same number GGR will arrive at, available now rather than after the sample GGR needs.
What it changes
A bonus played a few hundred times has a GGR you cannot trust and a True Value you can. An affiliate’s first cohort has a GGR that is mostly luck and a True Value that is mostly signal. A player in week one has no GGR history worth reading and a True Value on every session they have finished.
In one deployment, True Value identified a few hundred players each worth well above the operator’s VIP threshold. Fewer than half were on a VIP tier. The operator was not careless. It was using the only number it had, and that number had not caught up yet.
Most of what a casino spends money on, bonuses, affiliates, reactivation, VIP treatment, is spent against an estimate of what players are worth. The next generation of operators will spend it against the value itself. Not because they have better data than everyone else, but because they stopped waiting for GGR to tell them what their play was already worth.
About the data
The book is 1.7 million sessions from several brands on the Fast Track platform, over 144 consecutive days in 2026. Brands, markets, dates and absolute values are withheld; all figures are ratios, percentages or indices. A session is one player’s bout of play on one day, and comes in three kinds: cash play with no bonus behind it, bonus play valued on the bonus as granted, and cash play within a day of a bonus session.
For the sampling charts we drew 4,000 random samples at each size and recorded the distribution of their GGR divided by their True Value. The daily chart is the real calendar, not a resample. True Value is calculated by Fast Track’s Greco engine from game return to player and volatility, stake sizes, bonus terms and bonus logic.
Ed Dickerson is director of product at Fast Track. True Value launched on 22 September 2026 and is on show at SBC Summit in Lisbon, stand A311.
Partner Editorial